石家庄泛胜科技有限公司

石家庄泛胜科技有限公司
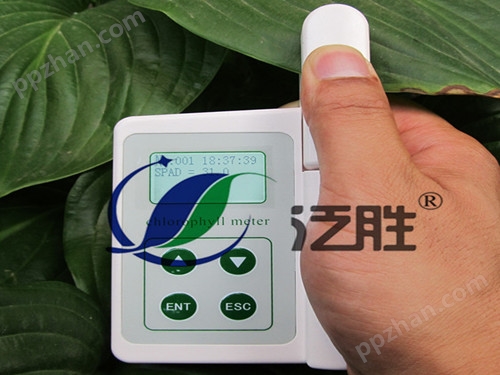
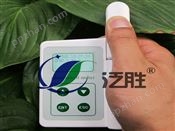
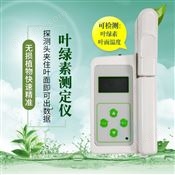
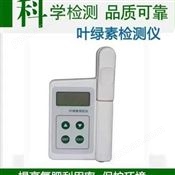
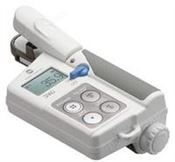
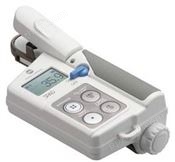
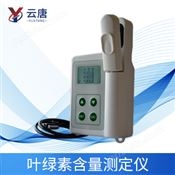
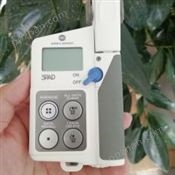
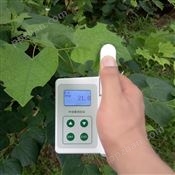
Chlorophyll Meter (叶绿素仪英文版)
Ⅰ. Introduction
Chlorophyll plays a crucial role in the photosynthesis of plants. Its content is an important indicator of plant nutrition stress, photosynthetic capacity, and growth conditions. Chlorophyll content measurement can be used to monitor the growth and development conditions of plants, thereby making scientific guidance of ction, fertilization and management, ensuring the good growth vigor, and enhancing crop quality and yield. As a result, it is of great significance for precision agriculture and forestry.
The chlorophyll meter is able to measure the relative content of chlorophyll in plant leaves (unit SPAD) or “greenness", thereby learning plants’ actual demands on nitryl and helping the user identify the shortage of nitryl in soil or whether nitrogenous fertilizer has been applied excessively. This meter can be used to enhance the utilization ratio of nitrogenous fertilizer and protect the environment.

Ⅱ. Operating Principle
Traditionally, chlorophyll content is measured using chemical methods, which not only time and energy-consuming and harmful to plants. With the development of spectrum technology, it has been a research focus to make quick noninvasive diagnosis using spectrum technology in precision agriculture. Spectrum technology is one that describes the information contained in spectrum data by means of the relationship between spectrum response and wavelength of the target. Spectrum characteristics of plants present the changes of light absorption, transmission and reflection of plants caused by their physiological features. Therefore, the physiological information of plants can be extracted by means of spectrum monitoring. The principle of spectrum-based crop physiological information detection is that changes of plant leaf color, thickness and morphology are subject to the influence of the changes of plant physiological information, thereby leading to varied spectrum absorption, reflection, and transmission features. For example, the spectrum monitoring of plant nitrogen nutrition is made by detecting different reflecting, absorption, and transmission spectra caused by different absorption and reflection of light of certain wavelengths due to the vibration response of chemical bonds of molecules of various proteins, amino acids, chloroplasts, and other nitrogen forms at a certain radiation level (different frequencies or wavelengths). When it is specific to chlorophyll, the spectrum absorption of chlorophyll is that the absorption peaks lie in the blue and red spectral regions while the absorption valleys lie in green spectral region. There is barely absorption near the red spectral region. When light reaches the leaf, some will be absorbed by chlorophyll, some will be reflected, with a small part penetrating the leaf. The relative chlorophyll content within the leaf can be worked out by measuring the light intensity penetrating the leaf, making A/D conversion, and processing data using the micro-processing unit.
Ⅲ. Measurement Principle and Steps
1. Measurement Principle
The two LED light sources emit two types of lights—red light (peak wavelength: 650nm) and infrared light (940nm), bot of which penetrate the leaf and reach the receiver. Next, light signals are converted into analog signals that are amplified by the amplifier and are then converted into digital signals by analog/digital converter. Digital signals are processed by the micro-processing unit to calculate SPAD, which is then displayed on the LCD.
2. Calibration and Calculation of Measured Value
(1) The indenter does not clamp the sample during calibration. The two LED lights are on in turn. The light received is converted into electrical signals. And the ratio of light intensity is used for calculation.
(2) When the sample is clamped by the indenter, the two LED lights are on again. Light that penetrates the leaf reaches the receiver, by which it is converted into electrical signals. And the ratio of transmitted light intensity is used for calculation.
(3) Values obtained in steps 1 and 2 are used to calculate SPAD, which signifies the relative chlorophyll content of leaf sample currently clamped.
Ⅳ. Major Technical Indicators
1.Measurement range 0.0-99.9SPAD
2.Measurement area 2mm*2mm
3.Measurement precision within ±1.0 SPAD unit (SPAD is between 0-50)
4.Repeatability within ±0.3 SPAD unit (SPAD is between 0-50)
5.Measurement interval <3s
6.Date storage SD card
7.Data storage capacity 2GB
8.Power 4.2V rechargeable lithium battery
9.Battery capacity 2000mah
您感兴趣的产品PRODUCTS YOU ARE INTERESTED IN

包装印刷网 设计制作,未经允许翻录必究 .
请输入账号
请输入密码
请输验证码